Grafana_install En
Grafana is at the top of many stacks of services that together generate observability platforms and such, just because it has a very general use: to display stuff.
For this reason and because it does what it does very well, you’ll find Grafana stuff around also on top of standalone applications, as screenshots of graphs in articles online or in any other contexts where you have some data that you need to display.
It is very easy to deploy and minimal in resources.
Tutorial
We’re gonna deploy a Grafana service inside a podman container, that is defined as a podman-systemd.unit and managed as a user service unit.
Assumptions
- A containers.blog.jacket.lime machine at 192.168.126.12
- there is no local firewall active on the containers machine
- cloud-user on the containers machine
Please note also that I assume that this setup is used only inside a closed lab environment, as the cofiguration could be polished more to make the services more maintainable and secure.
Ingredients
dnf install podman
Also make sure that you have the one of the directories in the podman rootless unit search path in place:
$ mkdir -pv ~/.config/containers/systemd/
Whenever there’s something that you don’t know or you want to learn more about,
your first point of reference should be: man 5 podman-systemd.unit
Also it would be useful to add a ~/.config/containers/systemd/blogposts.network file with the following content:
[Network]
NetworkName=blogposts-network
This way, after a systemctl --user daemon-reload, you’ll have a blogposts network that you can
share between your quadlets, so that they can see each other and resolve each other’s names.
You can see the network in the output of podman network list.
Install a Grafana podman-systemd.unit
You’ll need to decide which version of the software you want. If you don’t know use the latest available version
by sticking to a specific (biggest) version tag, avoiding the tag latest:
If latest points to 12.2.0-17449462949, then your command line is:
podman pull docker.io/grafana/grafana:12.2.0-17449462949
The podman-systemd.unit files look like the following:
# ~/.config/containers/systemd/blogposts__grafana.volume

[Volume]
VolumeName=blogposts__grafana
# ~/.config/containers/systemd/blogposts__grafana.container

[Unit]
Description=blog.jacket.lime's Grafana quadlet

[Container]
ContainerName=blogposts__grafana

Image=docker.io/grafana/grafana:12.2.0-17449462949

PublishPort=0.0.0.0:3000:3000

Volume=blogposts__grafana.volume:/var/lib/grafana

Network=blogposts.network

[Service]
Restart=always
TimeoutStartSec=900

[Install]
WantedBy=multi-user.target default.target
We’re exposing this service on port 3000 and putting the container in the blogposts network, so that it will be able to see other systemd/podman units on the same machine. We’re also mounting the named volume at a path where grafana stores settings and users and such. And that’s about it.
Now after a bunch of calls to systemctl:
systemctl --user daemon-reload
systemctl --user enable --now blogposts__grafana
You should see the Grafana’s web app coming up on this machine’s ip on port 3000.
The initial credentials are admin:admin, then it will ask you to change the password.
Helpful troubleshooting commands
journalctl –user -e -o json - checks all the fields of a log record in the journal
journalctl –user _SYSTEMD_USER_UNIT=blogposts__grafana.service - check logs only for that specific user unit
podman volume ls - check if the podman/systemd magic has spawned a named volume for your Grafana
Plug stuff into Grafana
From the web app, you can go to Connections > Data Sources and add stuff such as the Prometheus service that we configured in one of the previous posts.
From Connections > Data Sources onwards you just have to select the Prometheus type and complete the Connection form at the value: Prometheus server URL.
Mind that our value is not http://localhost:9090 but http://blogposts__prometheus:9090, where blogposts__prometheus is the container name of the Prometheus container, that is resolvable in the blogposts network.
At the end of the page, you’ll find a Save & test button.
If once clicked everything’s green, then you can start using Prometheus data in Grafana dashboards.
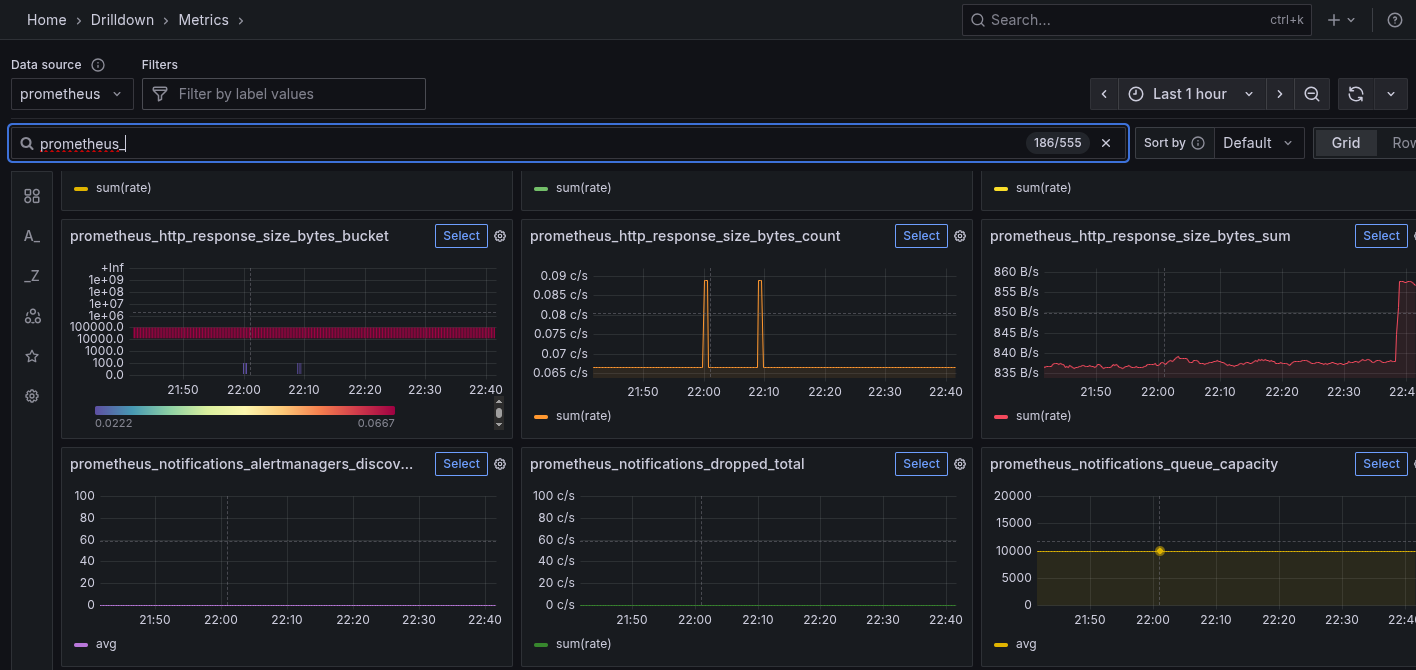
You’ll find available data to build your dashboards in Home > Drilldown > Metrics

The same goes for a previously deployed Loki service: select the Loki data type in Add nrew data source, point Grafana towards http://blogposts__loki:3100, save and test it, and then you should see results in Home > Drilldown > Logs.
Mind that in order to see logs you should filter for the specific job that you’re looking for. If everything is setup correctly, you should just click on the filters field and popups should greet you.
